Pagina 2 van de 15 resultaten
Sorteer op
-
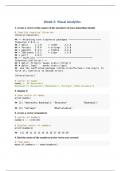
Visual_Analytics_Week3_Solved
- Tentamen (uitwerkingen) • 9 pagina's • 2023
- $10.49
- + meer info
Follow the instructions in the book to create a new project. Give it a name and an author. Execute the 3 code snippets from the preface to bring all the packages into this new project then create a new R Markdown document as instructed by the book. Load the tidyverse and socviz libaries. In order to execute code in an R Markdown object, the code must be enclosed by: ```{r}.....``` Use R studio to complete the following: 1. create a vector of the names of the members of your immediate family ...
-
Visual_Analytics_NEC_All_Weeks_Solved_Week3_to_Week15_Solutions
- Voordeelbundel • 13 items • 2023
- $125.49
- + meer info
Visual Analytics All weeks solved from week 3 to week 15. Read the week description and access the right document for that week. Report any errors found and they will be fixed accordingly. Don't share the document, instead share the link to this advertisement.
-
Plotting_Visual_Analytics_Week4_NEC_Solved
- Tentamen (uitwerkingen) • 19 pagina's • 2023
- $10.49
- + meer info
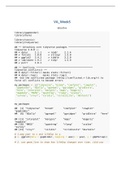
1. Show meta data from the mpg dataframe using summary(). 2. Show metadata from the gapminder dataframe 3. assign ggplot(data = gapminder, mapping = aes(x = gdpPercap, y = lifeExp) to the variable 'p' 4. find the structure of the p object. 5. add () to the p object. Show p. 6. replace () with h(). Show p. 7. return to and add h(). Show p. 8. add the linear element to the h function. Show p. 9. change the x axis scare to log10. Show p. 10. try scale_y_log10(). Show p. 11. change the...
-
Showing_the_Right_Numbers_VisualAnalytics_Week5_NEC_Solved
- Tentamen (uitwerkingen) • 27 pagina's • 2023
- $10.49
- + meer info
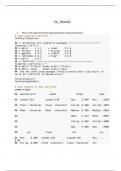
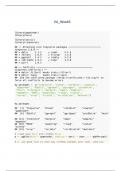
According to the author, 'ggplot is an implementation of the grammar of graphics' which is a set of rules for producing visualizations of data. In this first plot, we will track the trajectory of life expectancy over time for each country in the data. 1. map year to x and lifeExp to y. 2. use geom_line to show how lifeExp changes over time. (did you notice a mistaken assignment to the y parameter in the book?) 3. use grouping to make each line refer to a specific country in the...
-
Showing_the_Right_Numbers_VisualAnalytics_Week5_NEC_Solved
- Tentamen (uitwerkingen) • 27 pagina's • 2023
- $10.49
- + meer info
According to the author, 'ggplot is an implementation of the grammar of graphics' which is a set of rules for producing visualizations of data. In this first plot, we will track the trajectory of life expectancy over time for each country in the data. 1. map year to x and lifeExp to y. 2. use geom_line to show how lifeExp changes over time. (did you notice a mistaken assignment to the y parameter in the book?) 3. use grouping to make each line refer to a specific country in the dataset 4...
